PAL is a free tool, which is available on codeplex . I was first introduced to the tool at a Microsoft Premiere Support Workshop put on by Clint Huffman. Admittedly, I am not a Performance Counter expert, quite frankly they can be a little daunting at times as there are so many counters that ship out of the box. But, at some point a person needs to turn to Performance Counters to identify that bottleneck, contention or IO problem.
I had previously run the PAL tool on my system(in a healthy state) just to get a feel for how the tool worked and what kind of report I could expect. Recently, I had the "opportunity" to run the tool in Production. We just came out of our regular Windows Patching Cycle. Our multi-node BizTalk group and SQL Cluster were all patched and rebooted. Shortly after that we started to see errors in the Event Viewers indicating that SSODB could not be reached like below:
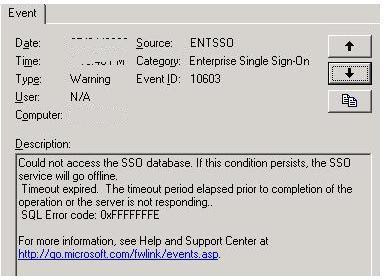
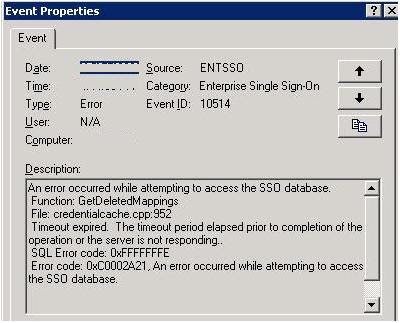
So as a BizTalk resource(Developer/Architect/IT Pro) you never want to see SSO problems in production. Without the Enterprise Single Sign On Service and dependent SSODB (database) your BizTalk applications will grind to a halt. The behaviour that we experienced was that our Host Instances were bouncing like a Yo-Yo. So based on this we knew that the problem was intermittent. We were never completely offline as we did have multiple sets of Host Instances configured, but when you see Host Instances bouncing you are really hoping that BizTalk's Guaranteed Delivery features are as advertised.
So there were many thoughts running through my head as I was really hoping to avoid any downtime. We do have some 24 x 7 systems, so when you go offline for even 5 minutes, you will be exposed. So I started thinking about what could potentially cause this issue, was it the Windows Patching? The Network? Was another set of databases running on the other side of the database cluster causing contention on the SAN? Was this limited to 1 BizTalk Server or were all having connection problems?
I was able to determine that all BizTalk App servers were having problems with connections and yes the problems were intermittent. So this had me thinking it was probably something on the SQL Cluster...but once again where to start? I did follow up with our Windows Server team to see what was patched, they provided me with the list of patches installed. Nothing in that list seemed even plausible. So at this point, I did not really want to start 'guessing' or blindly poking around for a possible solution. I then thought about my good friend "PAL". I figured that if nothing else it would help me narrow down the scope of the problem and give some areas to further investigate.
After seeking the necessary approval to enable Performance Counters on the SQL Cluster, I promptly opened up the PAL tool.
The first thing that I did was change the "Threshold File Title" pull down to select "Microsoft BizTalk Server 2006". This would allow me to have all of the BizTalk counters being accounted for in my logs. Also note that the BizTalk profile contains the relevant SQL Server counters as well.
When you click on the "Export" button, an HTML file will be generated that will include your Performance Counter configuration.
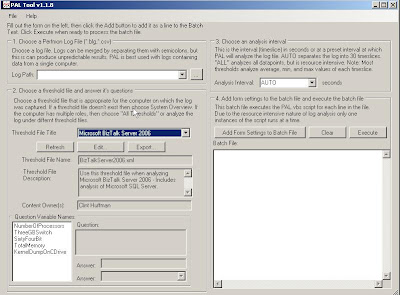
Once you have your HTML file, you will want to copy that file over to the server that is under duress. Once you have copied that file you will want to open up "PerfMon". You can do this by typing PerfMon from a command prompt or from the Run option(under start menu).
Once you are in PerfMon, you will want to right mouse click on "Counter Logs" and select "New Log Settings From". You then browse to the location where you copied your Exported "HTML" file
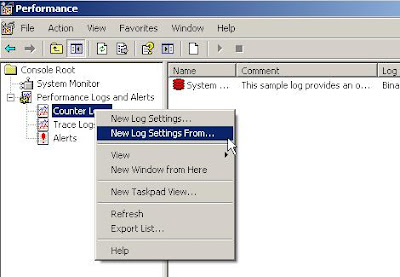
You will then be presented with a dialog box where you can add or remove any counters that are relevant/irrelevant. Complete the dialog box and you will see your new set of counters configured and ready to be captured. You can enable the counters, by right mouse clicking on your new counter set and select "start".

You will need to leave these counters enabled for long enough to get a decent sample of data. If your intermittent problem occurs once ever few hours then you are going to want to get a few intervals in order to get some decent data. Systems rarely run at peak demand all of the time, there are usually some regular "peaks and valleys", so you will want to take this into account when running PerfMon. Also be aware of the amount of disk space you have available for where your Performance Log will be written. This will also depend on how long your test will run.
Once you have collected enough data, stop your Perf test by right mouse clicking on your counter set and select "Stop".
From what I have been told, running PerfMon will not degrade the performance of your system significantly. However, it is advisable to copy your Perf log off of the problematic system and on to your PC or appropriate or server for the next steps.
- So go back into the PAL GUI, and in step # 1 "Choose a PerfMon Log File", browse to the file that you just copied from your problematic server.
- In step number 2, answer the questions at the bottom left hand corner. The tool wants some further information about your configuration so that the analysis can take these variables into account.
- Choose the appropriate Analysis interval. For my situation, I went with "AUTO". This breaks the log down into 30 time slices which was suitable for my situation.
- You then want to click the "Add Form Settings to Batch File", A command will then be displayed that will want to execute by clicking on the "Execute" button.
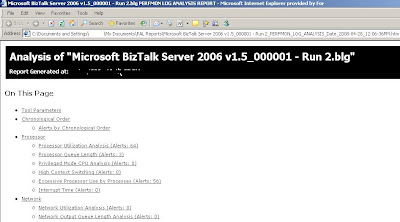
- A command window will open up that will execute that Analysis script. When this finishes, an HTML based report will be displayed with a report including the "Red/Green/Yellow" show and charts.
PAL will analyze a ton of data, it has great coverage. Everything is laid out in a logical fashion and since Clint is comparing your data captured against the thresholds deemed "safe/unsafe" by the product teams, you can be confident that the information being presented is applicable.
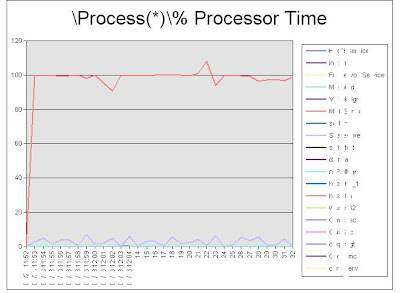
So what ended up being my problem? It was a non BizTalk, non SQL Server related service whose name shall be withheld to protect the "Guilty". The service had spiked, caused the CPU to spike and was creating CPU contention.
Here is the chart that helped me to identify the service, to resolve the immediate issue we restarted the service and notified the appropriate support group for further investigation.
Note: I have 'whited out' the names of the services in the picture below to protect the guilty service. The images that PAL generates are very clean.
So if you are Performance Counter guru, this tool can still help you out and provide a great summary of the information collected. The report generated provides you with some empirical data that can be used for Triage or to support some of your Change Management requirements.
If you are new to Performance Counters, not only does it take a lot of the guess work out of troubleshooting, Clint has provided information and links that allow you to learn about the various Counters and what they mean.
So as you can see the PAL tool is great and definitely needs to be a part of every Microsoft Developer/IT's Pro's tool kit.
No comments:
Post a Comment